Last Updated: May 2022 with updated SE Ranking data and an introductory offer
How does SE Ranking compare to other SEO tools?
Well, in a sentence… It certainly holds up! But you’re not here for a simple one liner. In this SE Ranking review, I cover all aspects of the tool and compare it to other tools on the market (especially those you may already know).
I’m also going to breakdown the process of using SE Ranking from the very start. Let’s get into it.
Sign Up For A Free Trial
SE Ranking Overview
Getting set up
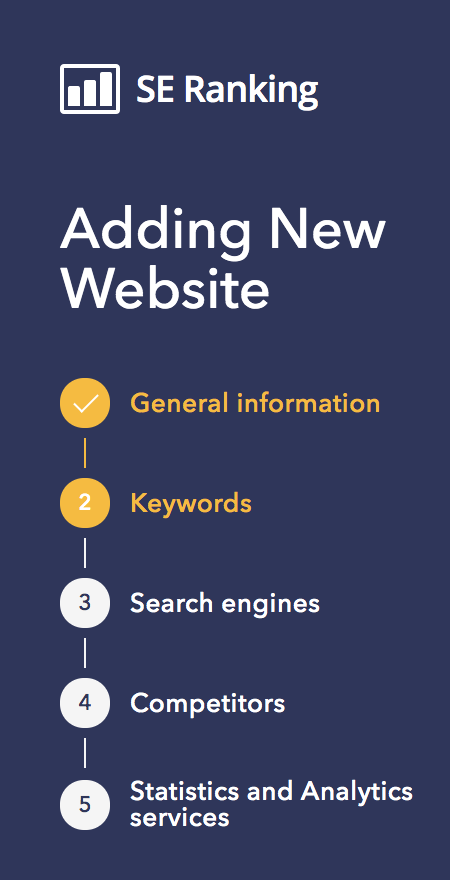
What I really like about the signup process is that it’s very simple, and there are no unnecessary steps. It’s just practical and to the point.
I’m also lucky to be writing this review at the time of the new interface, which is incredibly easy on the eyes and without any unnecessary fluff.
So, straight away as you’re getting set up, you’re given the option to either add your own keywords for your site, or the tool will suggest them for you. I’m lazy, and opted for it to suggest the keywords for me. And, they were really spot on. What I was pleasantly surprised about was that it also picked up on my blog and news posts, so it wasn’t all just about keywords related to being an SEO consultant.
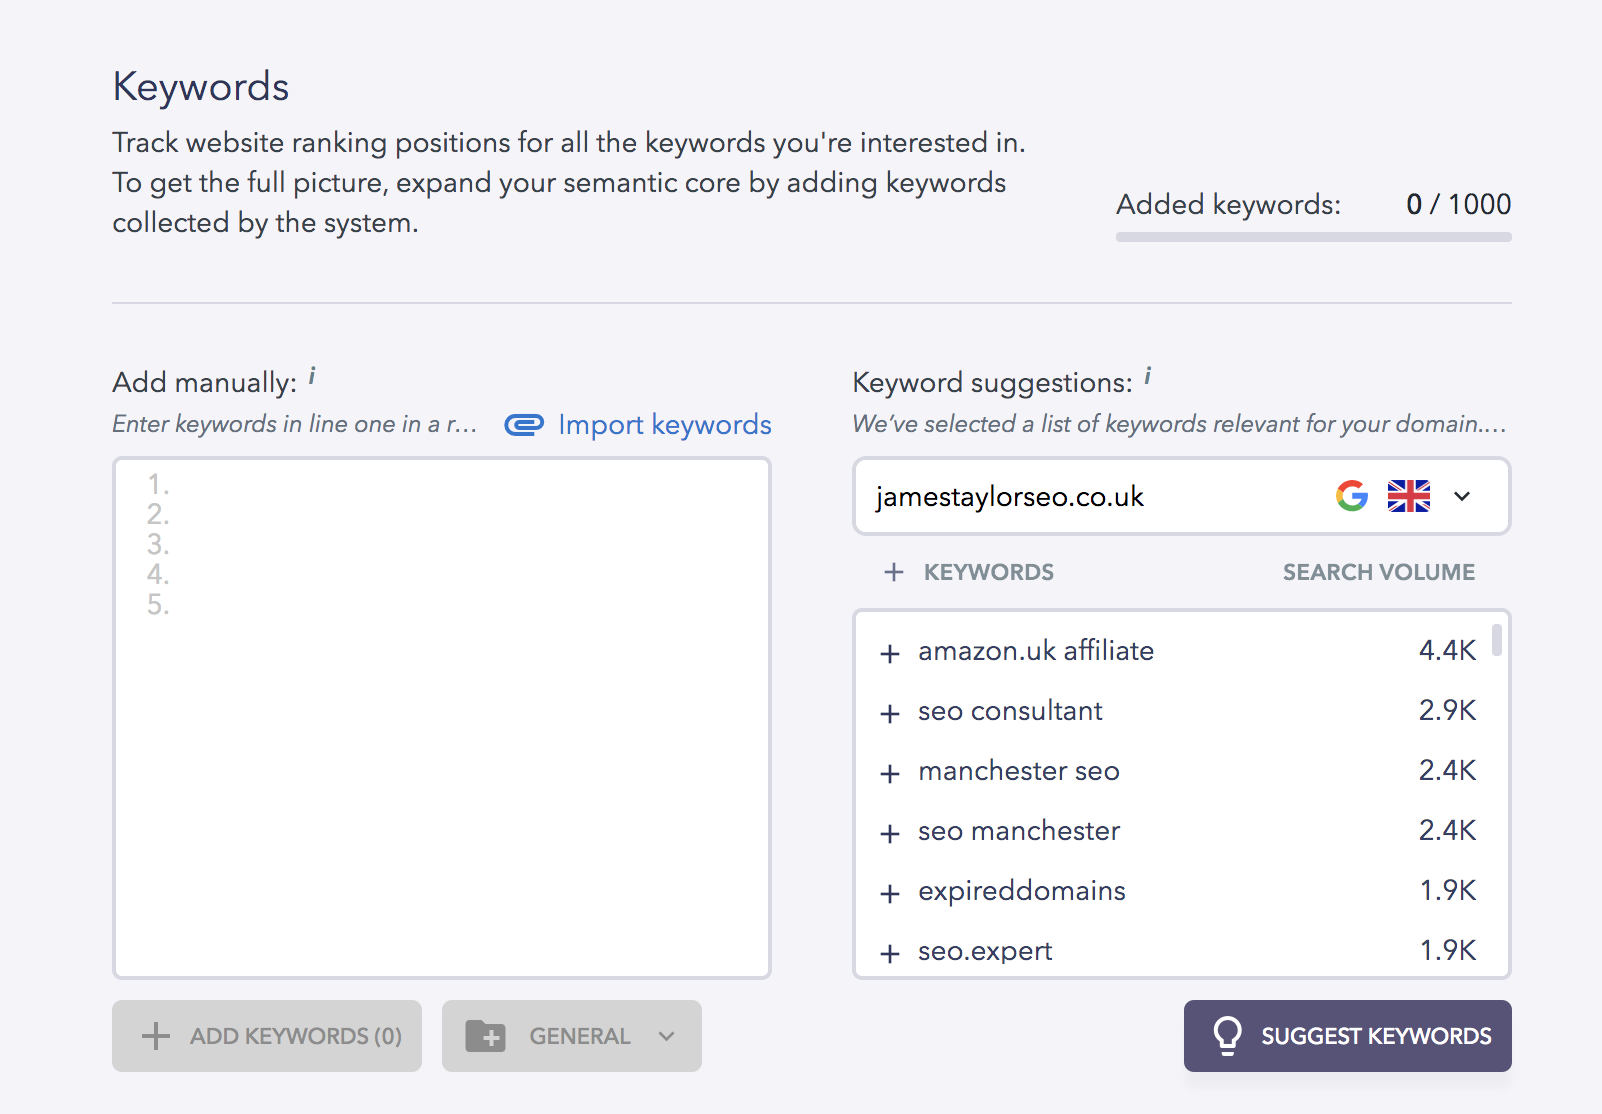
You can also choose between different search engines, even more than SEMrush (which again surprised me), and you can sync up to track progress of competitors alongside the site you’re adding too.
Finally, you can connect GA and Search Console profiles so that you know the data is as spot-on as possible. No more vague graphs or scary traffic dips because the tool is having a bad day!
Okay, so you’ve added your keywords, competitors, and connected the relevant accounts. Now what?
Features – Review & Breakdown
This could end up an absolutely giant review, but I appreciate that time os precious and you’re only going to want to read so much before giving it a go yourself.
So, in the interest of giving you the information that you came for, I’m going to outline the best sections of the tool, why you’d want to use them, and then also some other bits for you to think about in terms of wider digital marketing approaches.
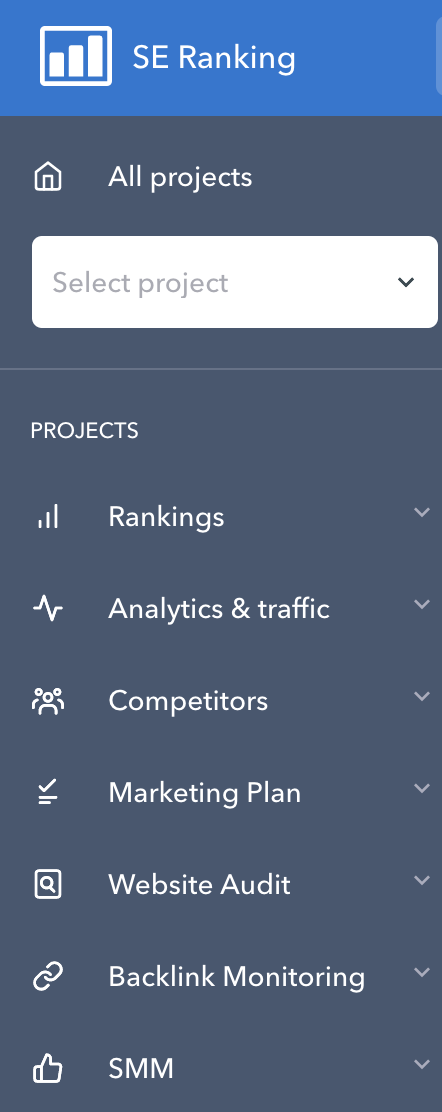
Dashboard & Usability
I’ve already said this, but the new design of the tool is fantastic. It’s faster than other tools, smooth, and quite minimal. Some people might not like that aspect as other tools can be quite ‘busy’, but I’ve actually found it a bit of a welcome break.
I’ve only got my site in here at the moment, but as you can see you’re presented with a really nice breakdown in terms of weekly or monthly overall visibility. Naturally, this will look much better once competitors are added, as you’ll then be able to see how the graph intersects and shows competitor growth at different periods.
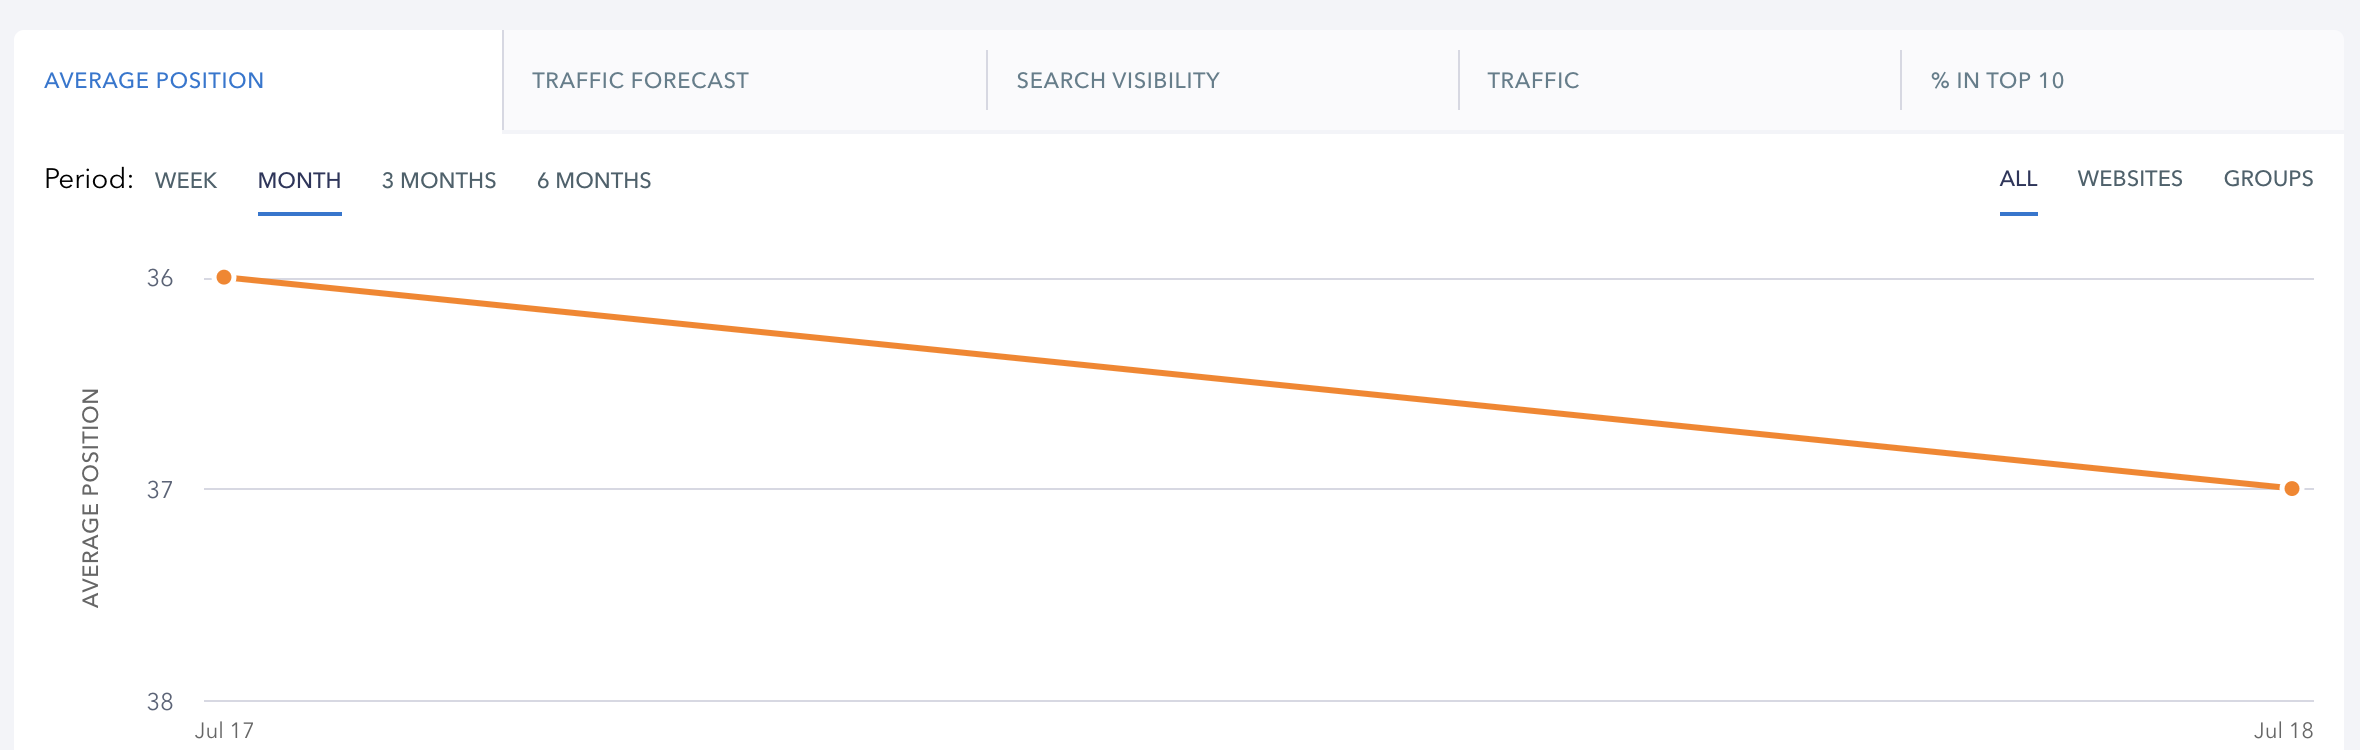
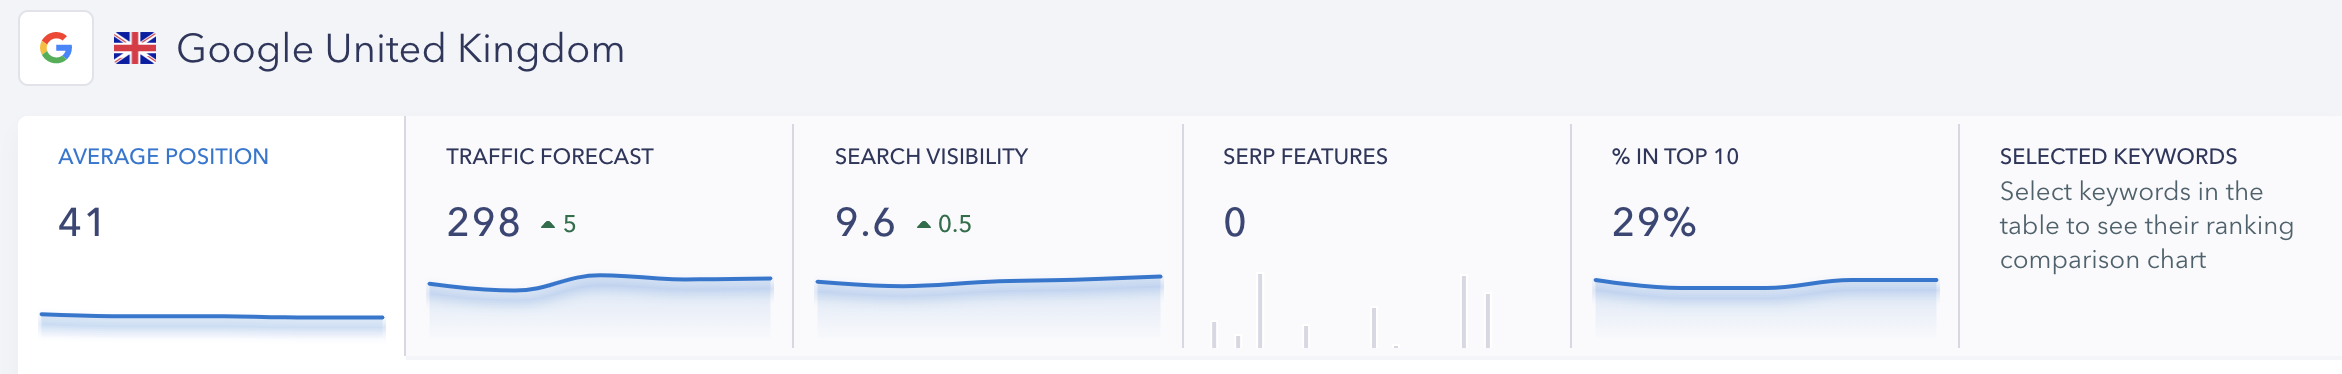
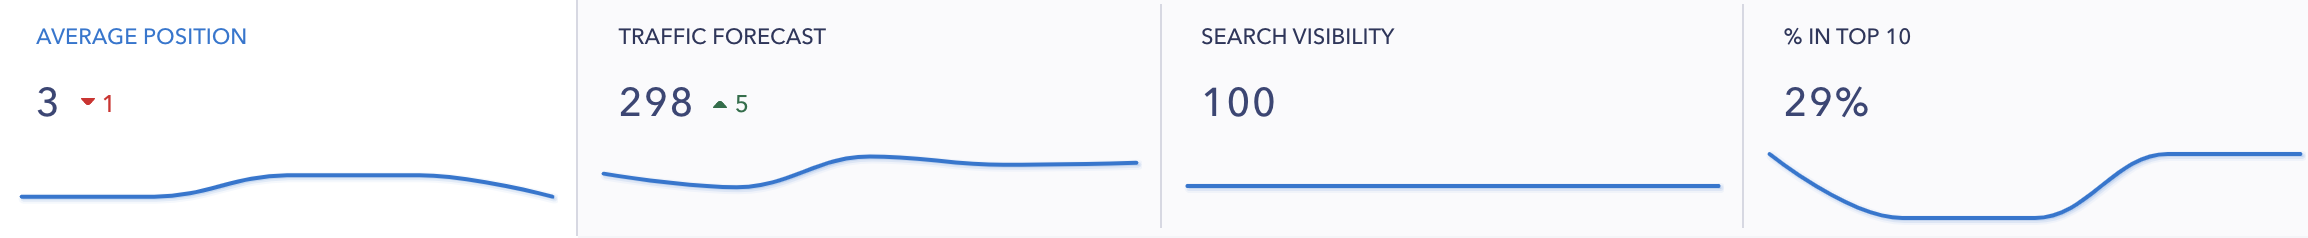
You can also look at overview of:
- Traffic Forecast – This is the potential amount of growth a traffic can experience via keyword visibility, based on the initial growth of the site that is tracked by the tool
- Search Visibility – How visible the site is within whichever search engines you’ve chosen to track it with
- Traffic – A nice graph taken directly from when you connect the Google Analytics account of the site to the dashboard
- % in top 10 – This is a really nice feature, especially for when calling clients and giving them a quick update of their site. The top 10 view is basically the percentage of keywords that are ranking in the first ten positions of your chosen search engine. If that’s something your client is adamant on knowing and using as a growth metric, then they’ll love that you can give them the information in a split second!
Competitor Analysis
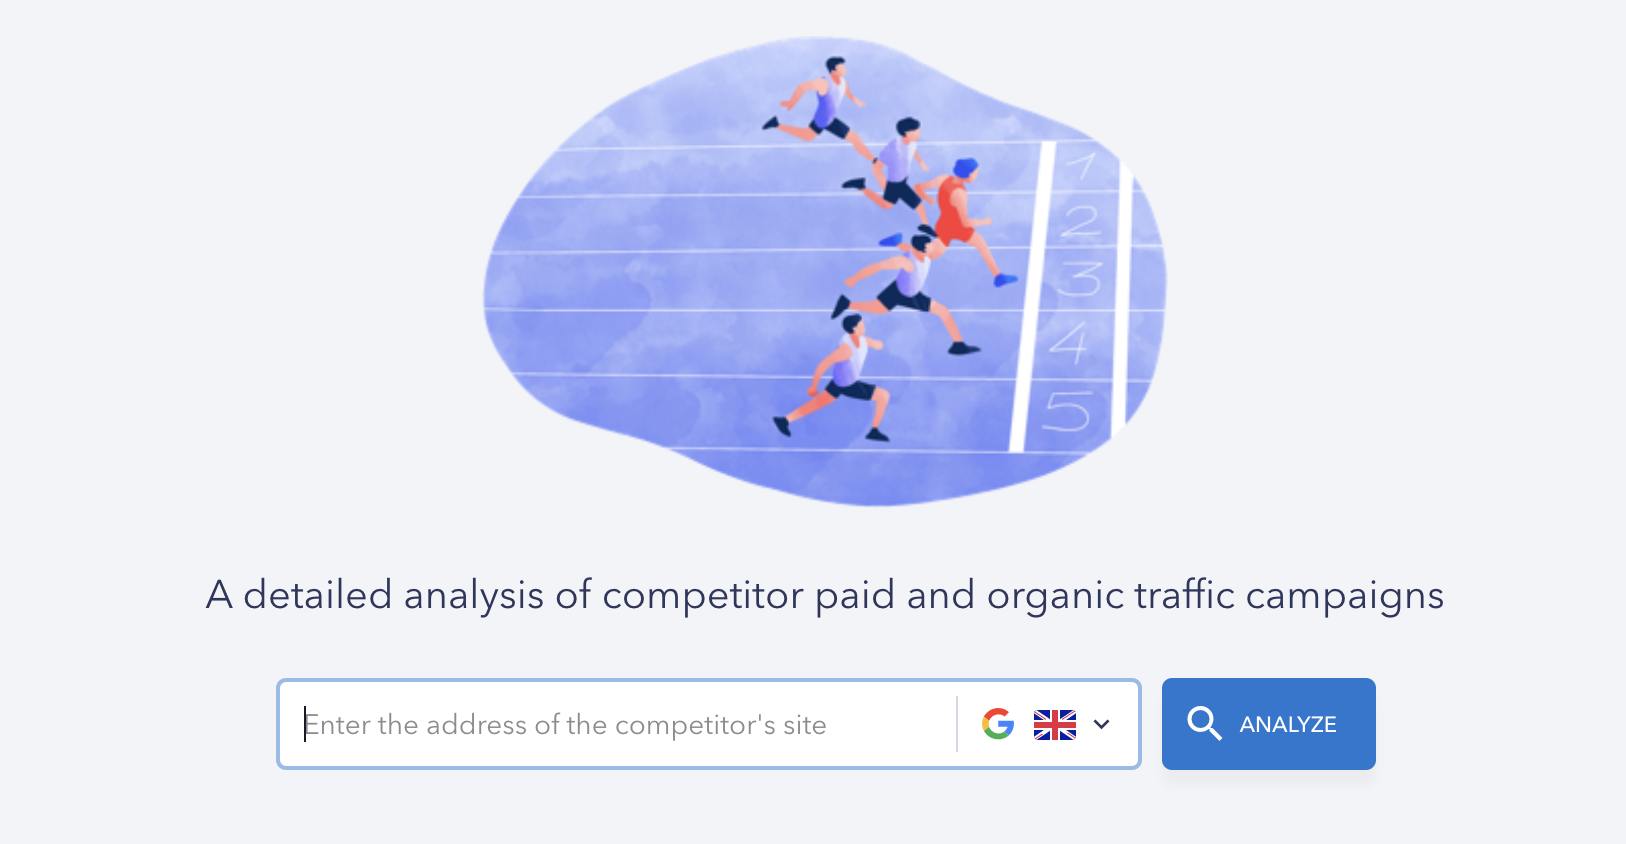
For the sake of finding a site that I know will actually have a whole load of data behind it, let’s imagine that Moz is my competition (maybe one day, ha!).
The competitor overview is very similar to tools like Ahrefs and SEMrush, which to be honest is totally expected. That layout is very effective, and it wouldn’t make much sense to chance something that isn’t broken. This is also easily one of my favourite sections of the tool, so brace yourself for the breakdown that follows…
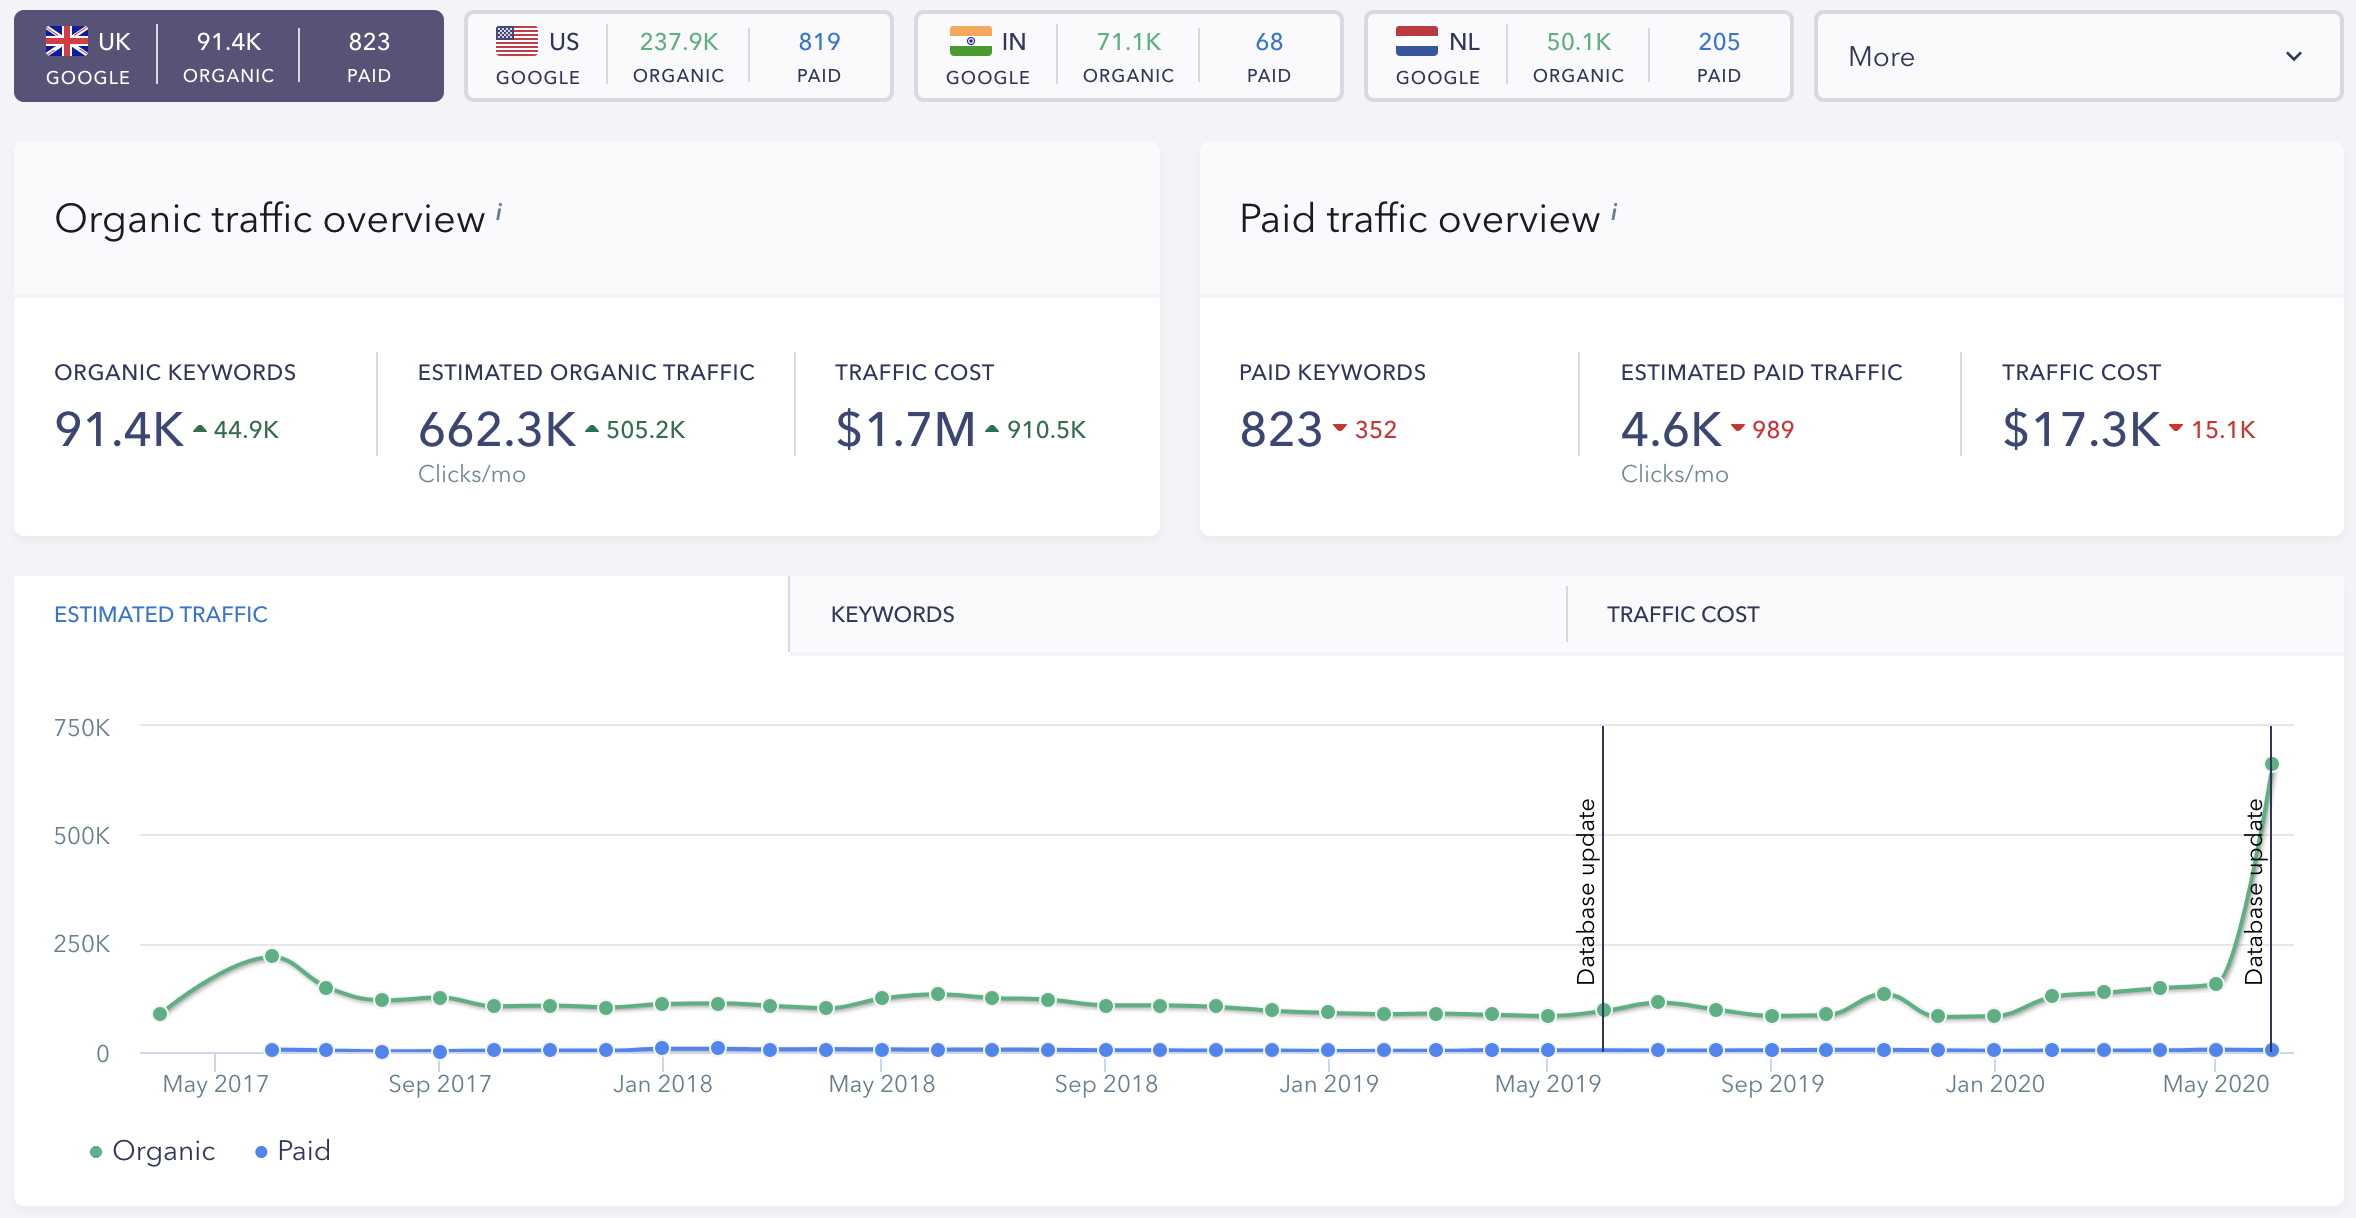
Alright, so what does this data mean and what can you actually do with it?
- Organic keywords – The number of keywords that are indexed in Google’s UK search results. This is particularly useful if you’re looking to see how your competitor targets different countries, as you can switch between location views for Google or whichever search engine you’re looking at. You can also click into this to get a breakdown of data (I’ll get into that further on in the review)
- Estimated organic traffic – Obviously they’re not going to show you the actual GA data that a member of Moz might’ve connected to the tool. Estimates are usually accurate though, so it’s good to see how much the competitors that are doing better than you can get if you reverse engineer their strategies and get to their level
- Traffic cost – The estimate cost of the organic traffic if you were to pay for it via Google Ads. Or another way to look at it is how much you’d be paying for that amount of monthly traffic, which is another great way to justify an organic strategy when you can see just how expensive paid ads traffic actually is
- Paid traffic – How many keywords they’re bidding on, the amount of paid traffic they’re estimated to get, and then also directly how much they’ll be paying for that amount of paid traffic. It’s then good to see how much of an investment you need for organic vs paid marketing, when you can see traffic costs vs the amount of traffic that a competitor actually gets
You can then filter that graph data between organic and paid. Scrolling down further we see:
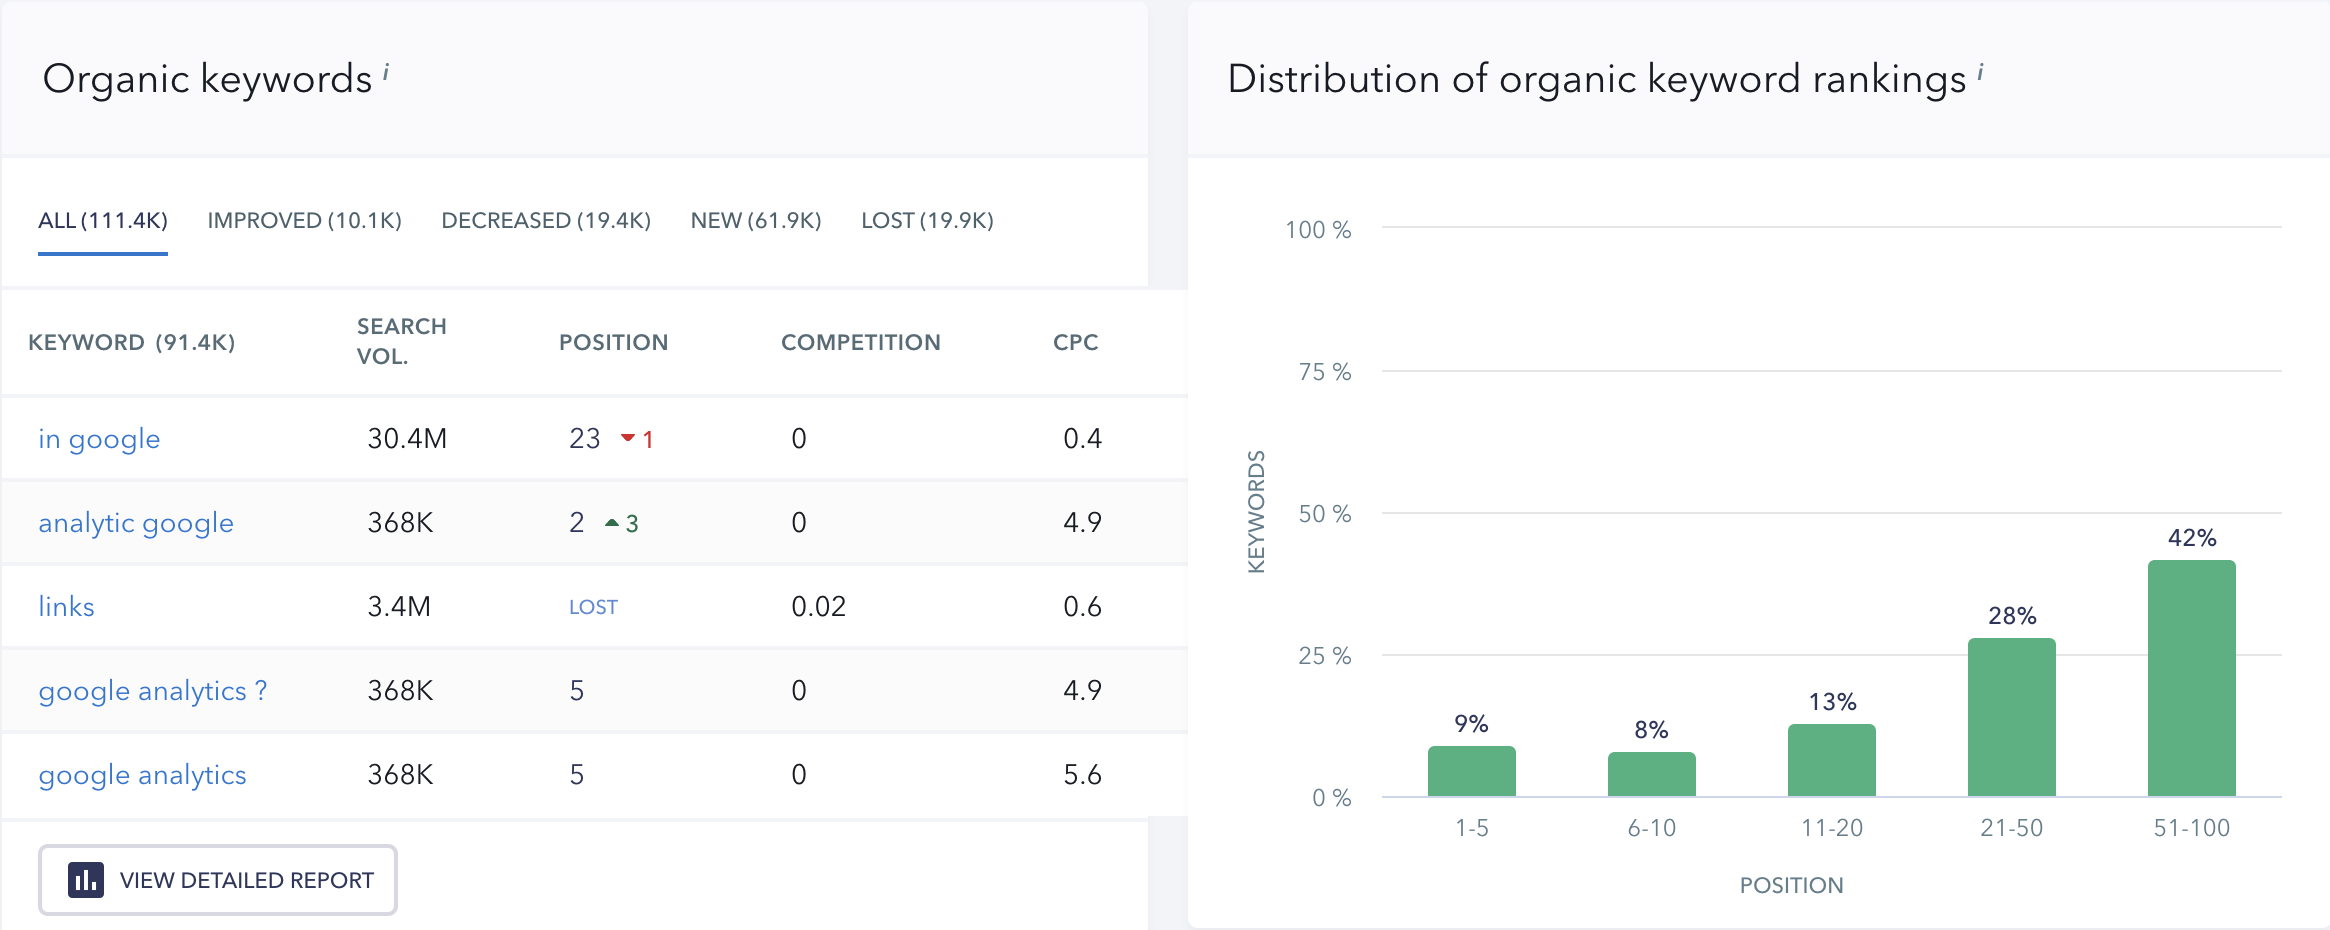
- Organic Keywords – An initial overview, and then you can click into a detailed view which gives you an extended table view
- Organic ranking distributions – The percentage of keywords between core tracking positions. I think with this one, you’re going to see any large site with the largest percentage at 51-100, as that is just the nature of long-tail keywords., Focus on the keywords from 6-10 if you actually want to look for gap areas in the keyword strategies of your competition
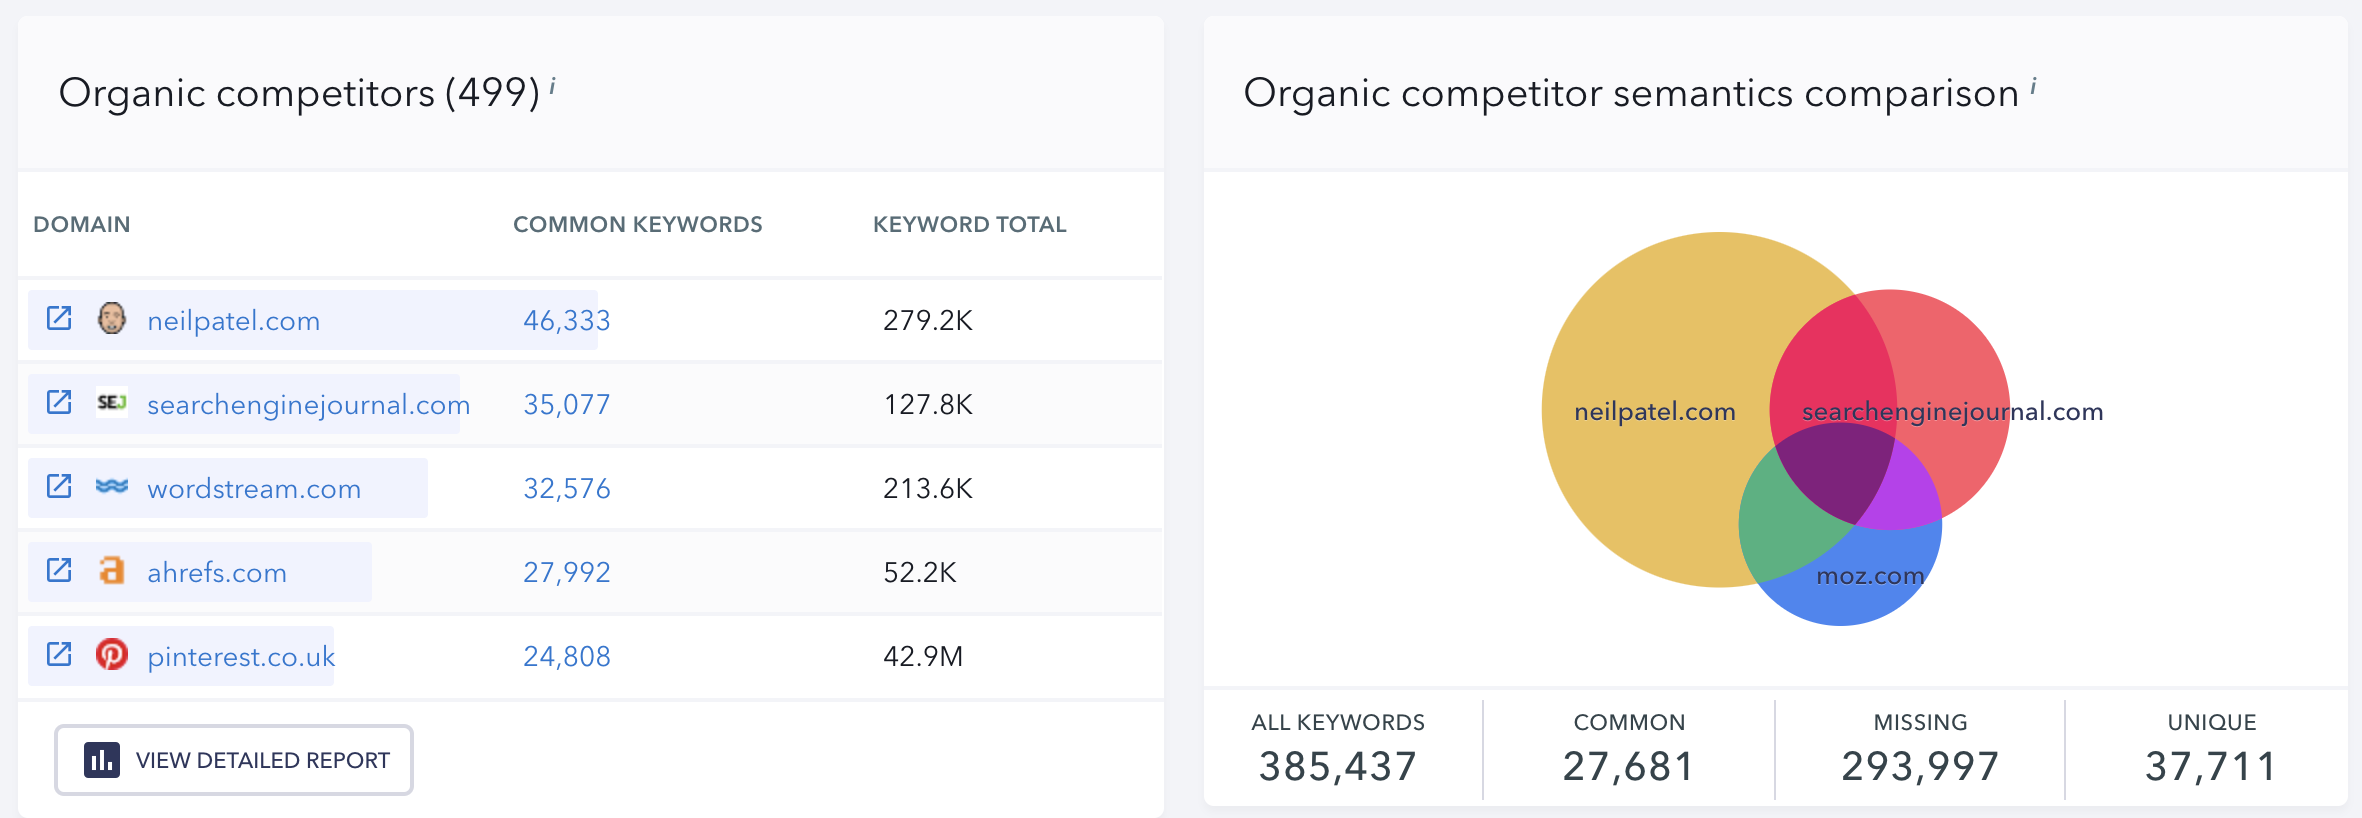
- Organic Competitors
- Semantics Comparison – This is… brilliant! Semantics is at the forefront of SEO and something that is certainly worth taking the time to learn more about if you’re new to search engine optimisation. Essentially with this graph you’re looking at the intersect of target keywords between yourself and your competitors. Interesting stuff. It’s also great for a content gap analysis as you can see the keyword unique to your site (and your competitors), and then also those missing which will uncover some fantastic, rare targeting opportunities.
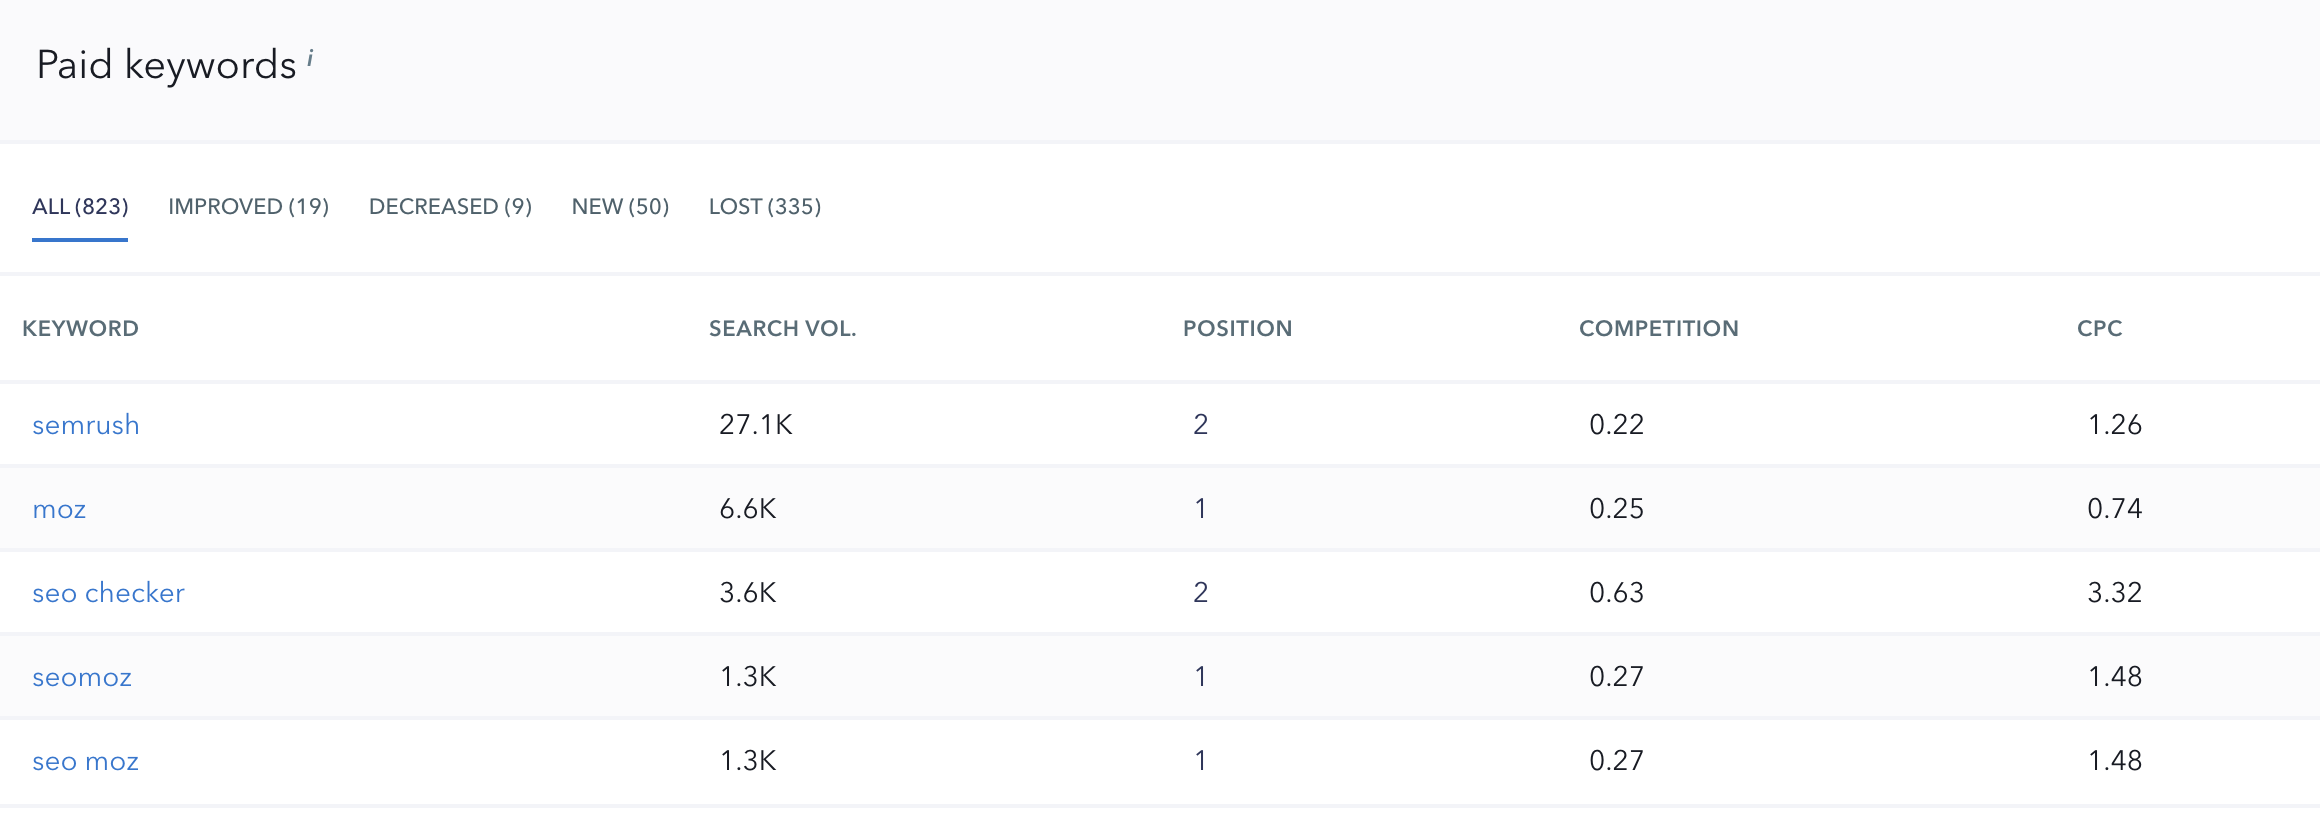
- Distribution of Paid Keywords – Again, this is another way to gain a top-level understanding of the PPC budgets you’ll need for your sites based on competitor spend, and you can also see those that have dropped or stopped being bid on by them (meaning you can see gap areas and also those that may be too expensive to even bother with).
- Paid Competitor Keyword Semantics
- Most popular Keywords Ads
I can keep going on about this competitor overview section all day, but just know that I’m barely even scratching the surface here. As I’m so used to using more commercial tools I wasn’t holding much hope for this section, but I’m very happy to be wrong. This level of data even within an overview section is fantastic.
Let’s now have a look at those specific to your site or your client, e.g. the sites you input into the project section and what you can get out of it.
Rankings
The way this data is presented and the options available make getting either a top-level view or putting together a detailed analysis as easy as possible.
The section is split into three main sub categories: Detailed, Overall and Historical Data. Let’s look at each individually.
Detailed
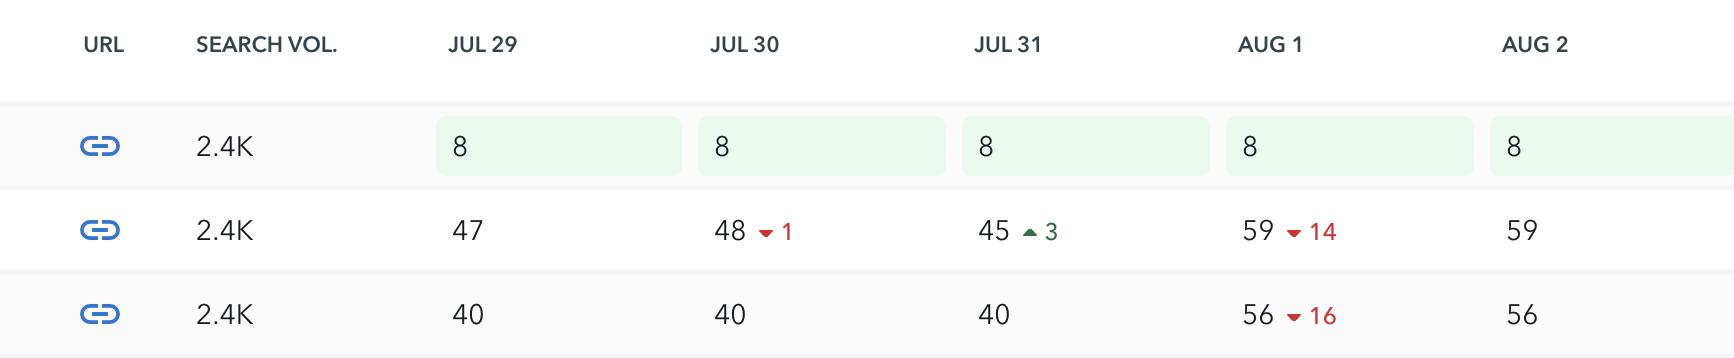
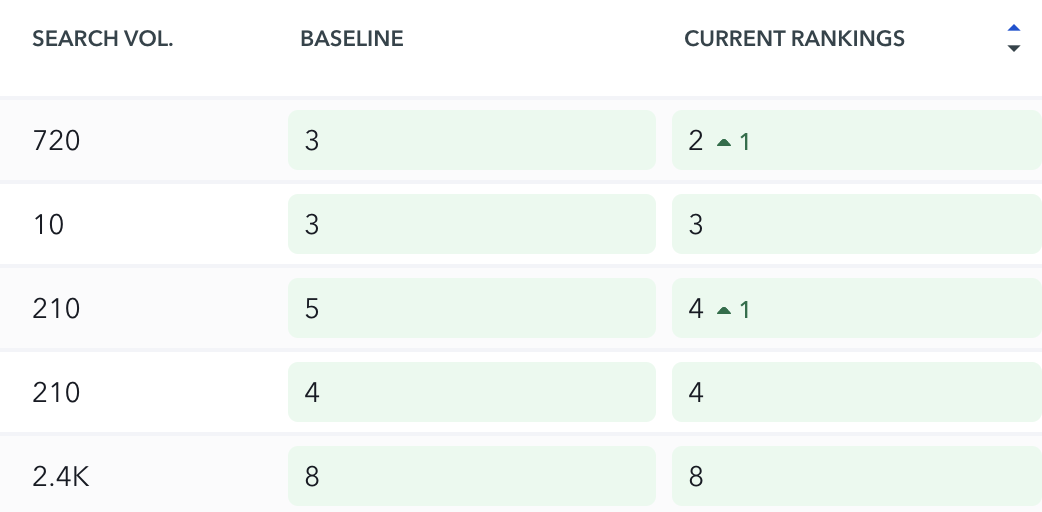
With this you get the initial overview like in the screenshot below, and then you also get a breakdown of tracked keywords that shows accurate position fluctuations by the day. The day! And, they’re actually accurate, which being daily is brilliant and a testament to the accuracy of data from the tool.
You then get this fuller breakdown of keywords with handy colour coding so you can see growth or dips at a glance:
Overall
This section includes a forecast of traffic based on historic data, search visibility and then percentage of keyword in top positions e.g. top 3, top 5 etc.
Historical Data
An comparison of data since the account was added. I like this the most for periodically reporting to clients e.g. they came on to use my SEO consultancy services 6 months ago, so here’s where the site was as a baseline 6 months ago and here’s the results 6 months later.
Analytics & Traffic
This section is why it’s vital you connect your Search Console and Google Analytics profiles to the tool, Essentially here you’re presented with very user friendly and UX-focused presentations of top-level analytics data, pulled from the analytics accounts of the connected site.
What this means is that you’re not then having to move between Search Console and Google Analytics, as overview data is available, in a very screenshotable format (yup I just made that word up).
Main points on this part of the tool to look at include:
- Date Comparison
- Sessions
- Users
- Page Views
- Bounce Rate
- Sessions Duration
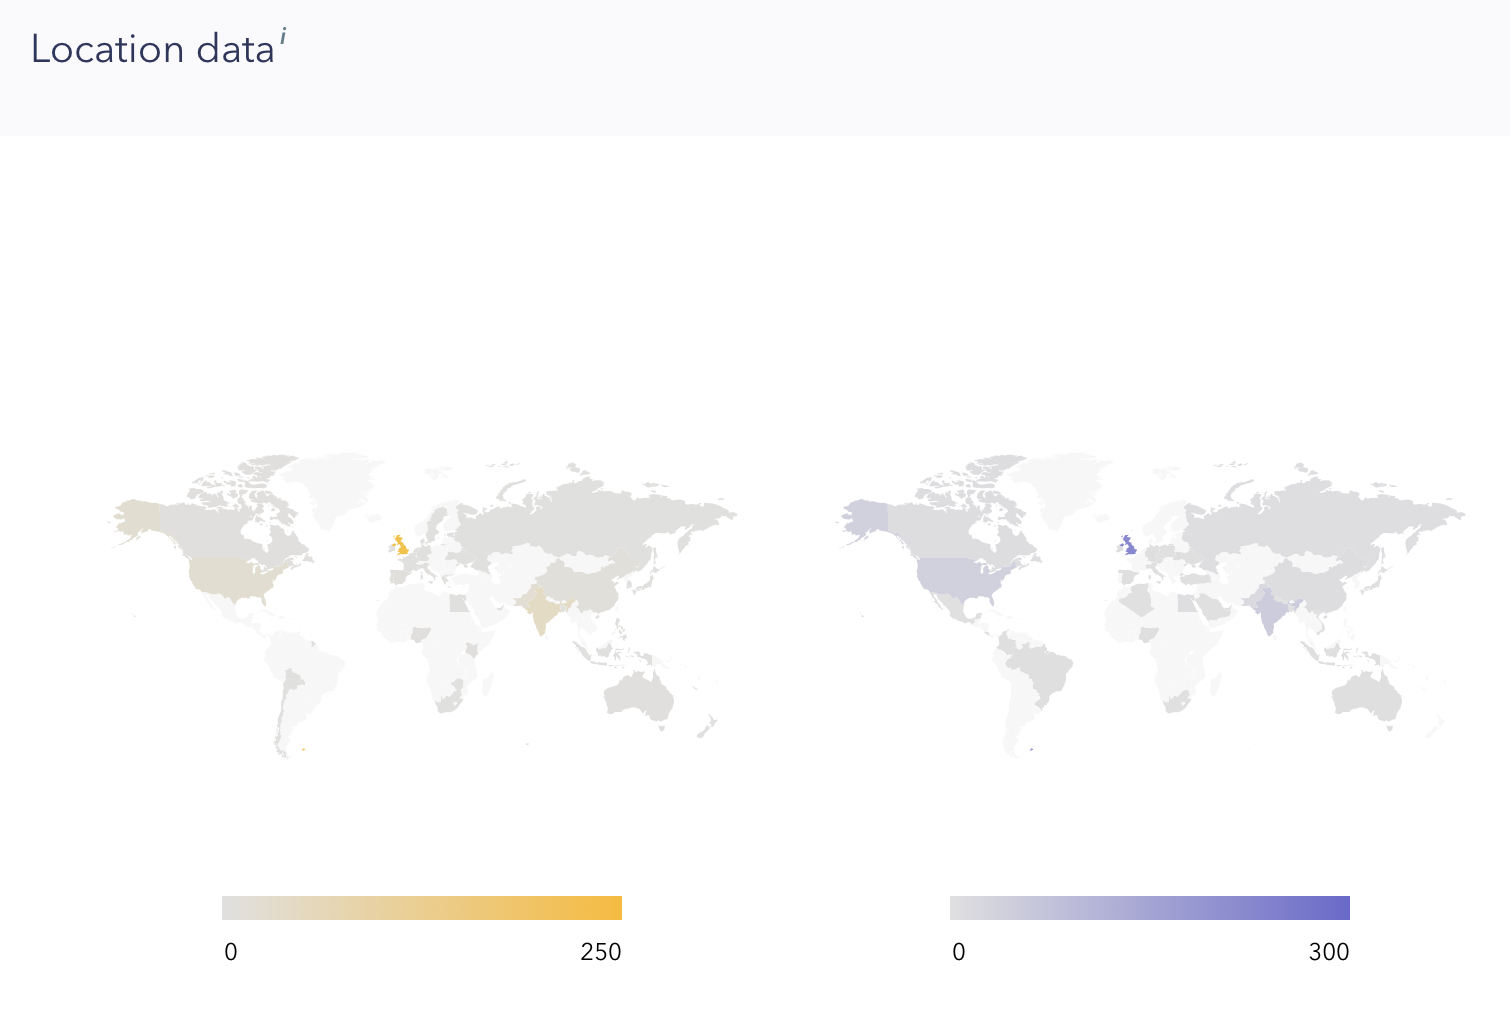
- Location Data
- Traffic Sources
- Search Visibility
- Keyword Overview
I love this again for the ease of looking at data that I’d otherwise have to scroll and set across different tools. It’s all about making your life easier when it comes to scanning and reviewing data.
Get Loads More Data
Competitors
I don’t want to spend too long on the first section, as it’s an overview of the competitors that you manually add at the start of the project (or the tool can suggest them for you). I’m much more interested in the second sub section, which is ‘SERP Competitors’. And it’s amazing.
SERP Competitors
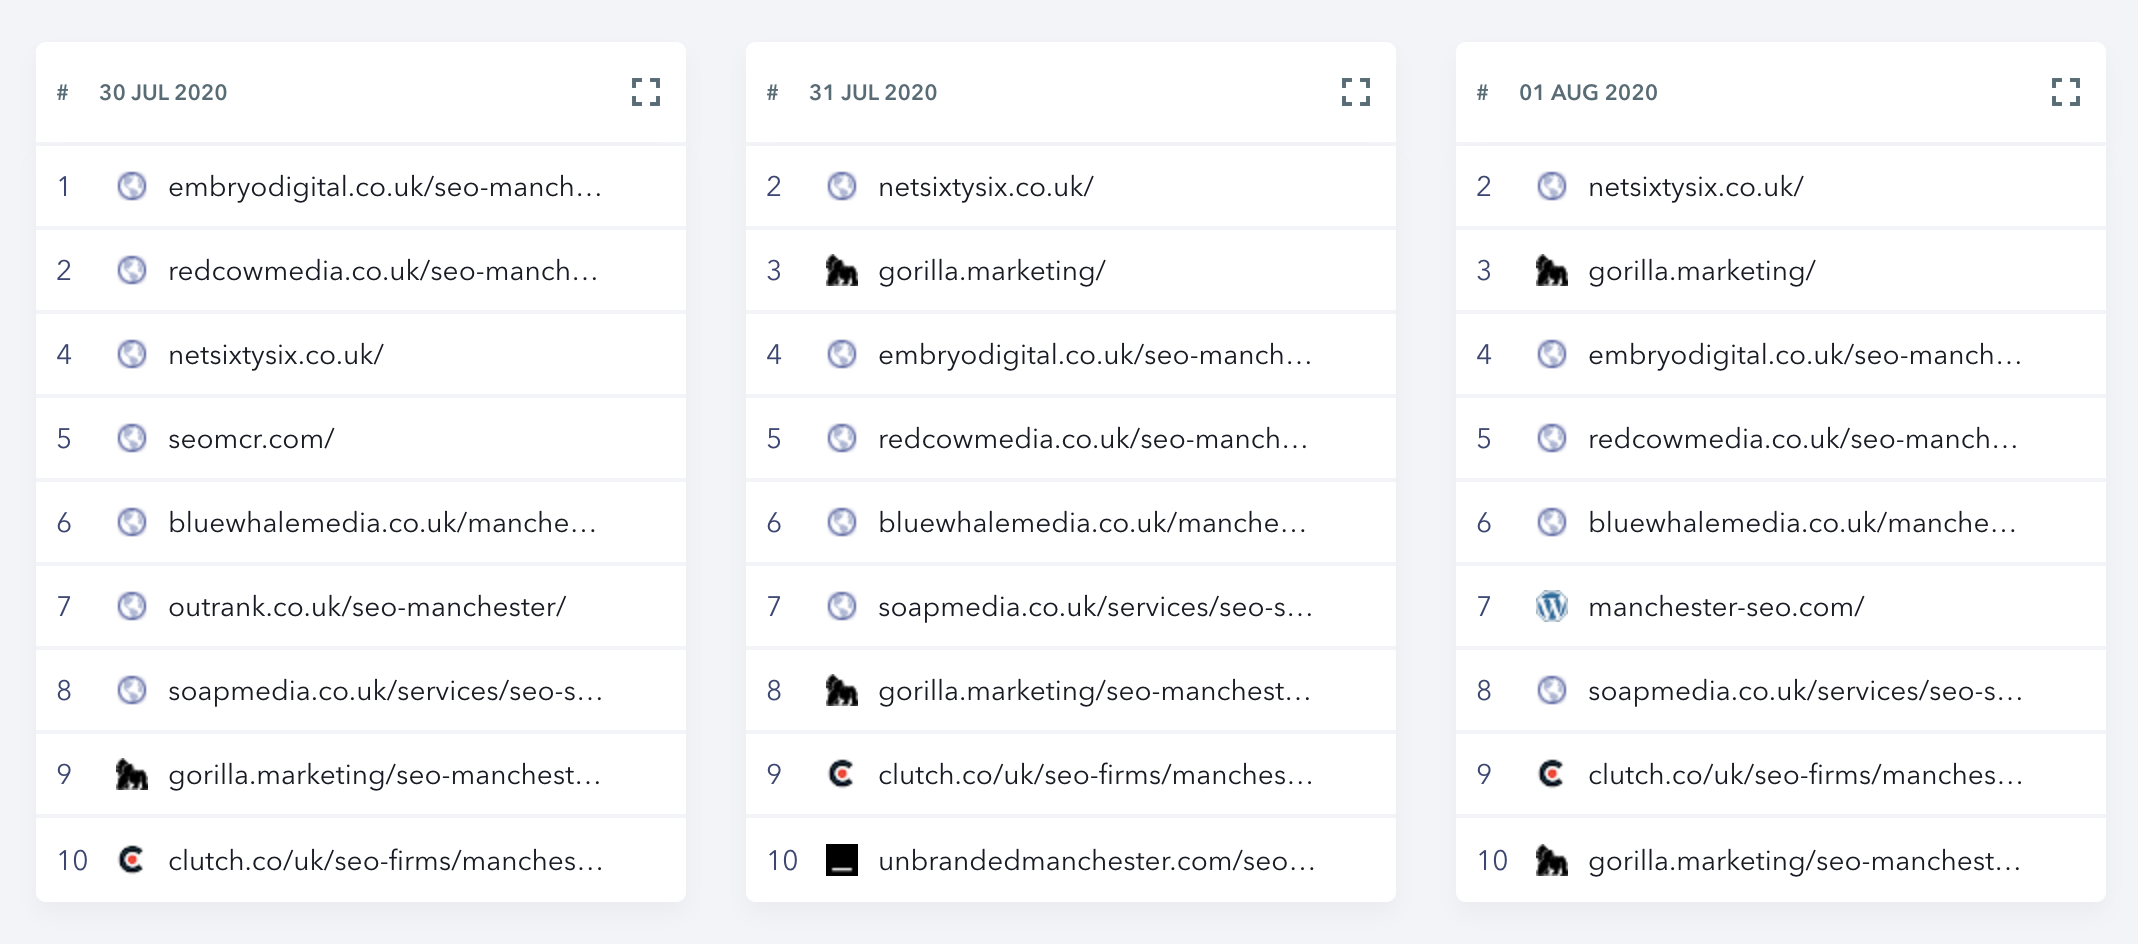
With this section you can see a dropdown of your tracked keywords and when selecting one will see an updated SERP result which compares the last few days so that you can see how competitors fluctuate on a daily basis. You can even highlight the competitors you’ve added at the start of project too.
This is fantastic because not only does it look good, but you can immediately see any jumps in rankings of tracked competitors to then see what they’ve been up to e.g. if they’ve recently gained links from an authority site or added some content that has bumped them up a few positions. Awesome!
Visibility
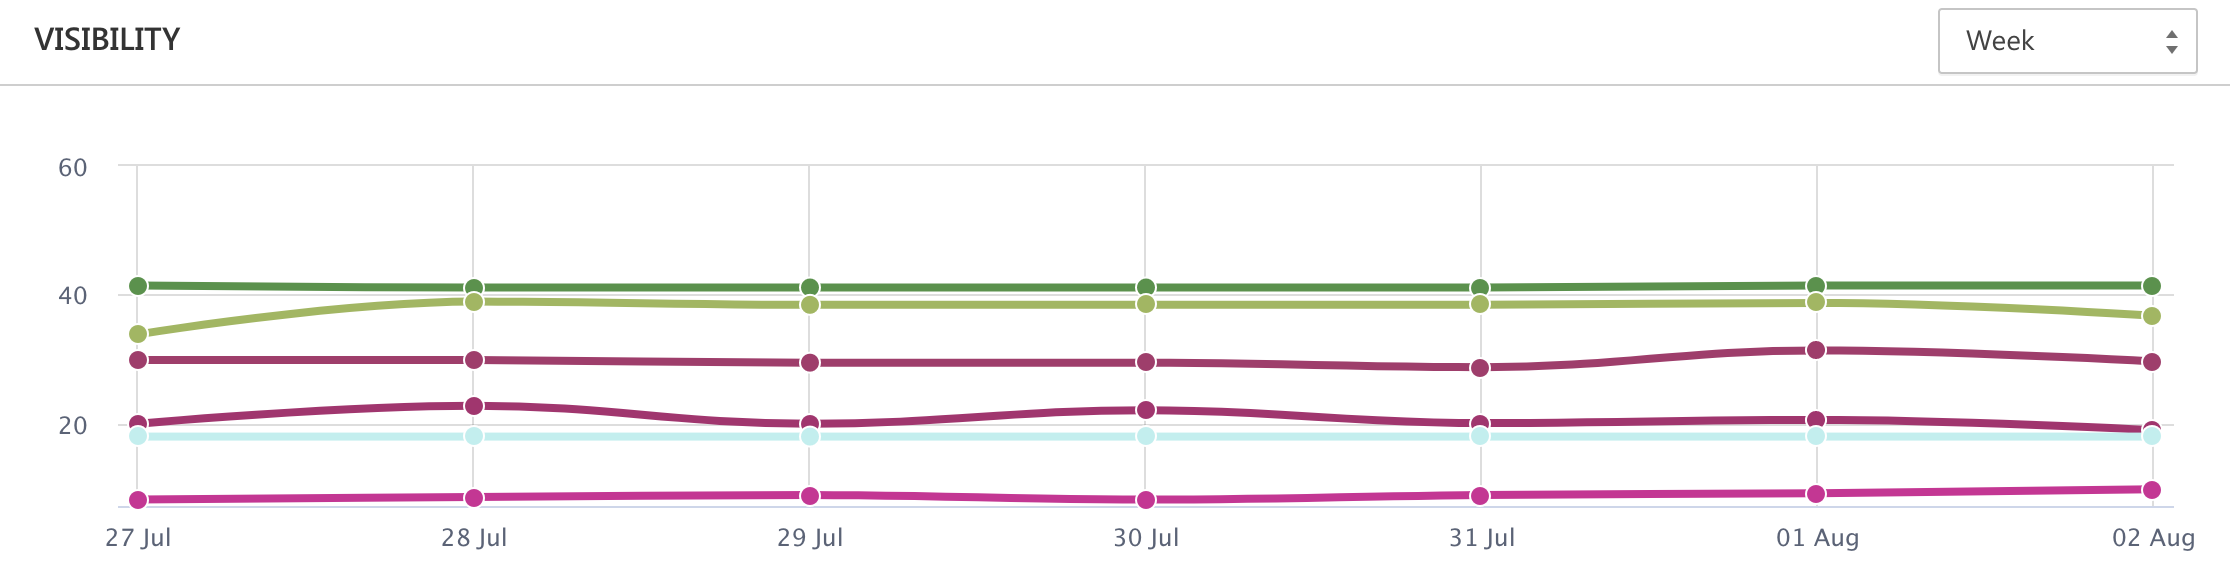
This is another really nice way to compare competitor growth, and it isn’t horrible on the eyes either! It’s data from the top tracked keyword alongside competitors to then work out those which are the most ‘visible’ in search results overall.
Marketing Plan
This is a fantastic section that some of the more popular tools can really do with adding. It’s split into two main sections for beginners:
To-Do List
This list completely breaks down what beginners need to be focusing on when it comes to SEO for their site. For those new to SEO and not knowing where to start, this really makes the process as easy to use start with as possible.
It then shows ‘how to’ dropdowns on how beginners can actually do the things listed. What I like about this is if a user has been running a site audit and isn’t aware on actually how to do the tasks flagged in the findings, then they can found out and create a task roadmap within this section.
Business Listings
Another fantastic section for beginners. This shows relevant, authority citations which users can sign up to and gain free links back to their site, otherwise known as citation link building. Again, for people who don’t know where to start, this is a much-needed addition.
Website Audit
I’m always moaning about site auditing tools, and would still never use just one when doing an audit. But, let’s look at my thoughts and ramblings on this section either way ey!
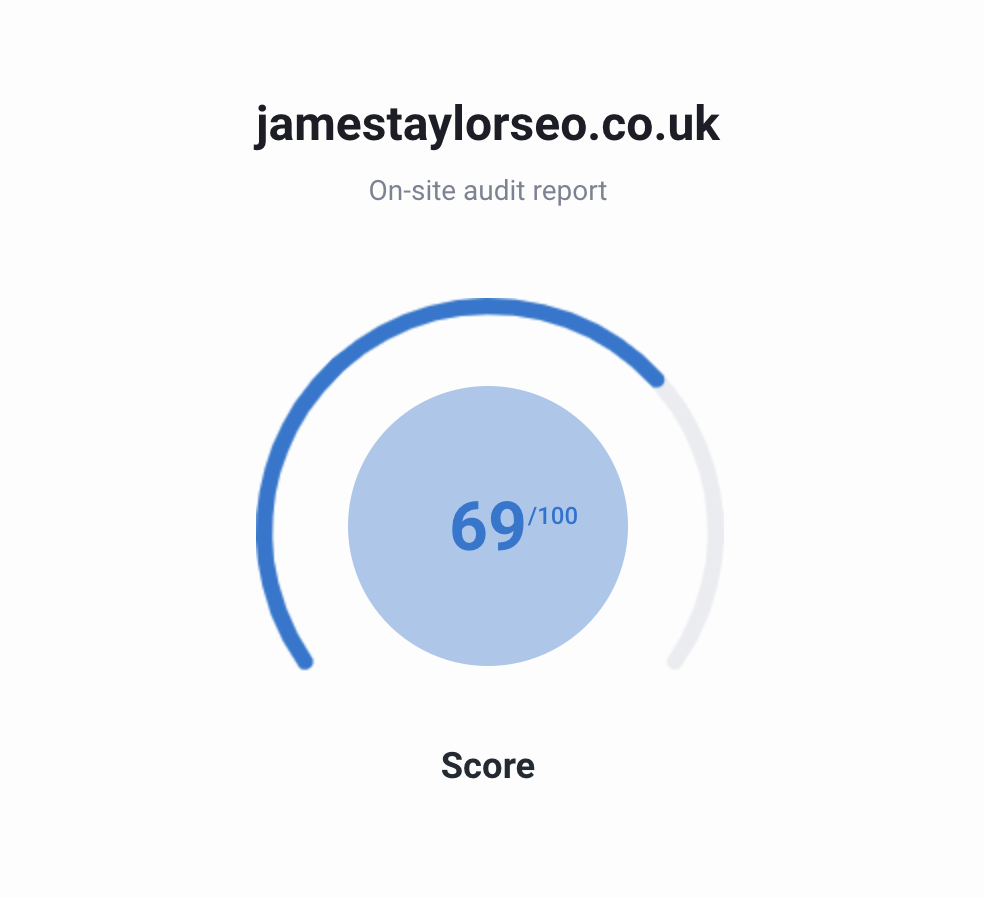
Okay, I really like this auditing section, if for the overview parts than anything else. I particularly like that it shows you how many pages are indexed across multiple search engines, meaning you can immediately see if any indexing issues with your URLs are consistent across Google, Bing etc.
Other cool areas and points to have a closer look at are:
- Domain Characteristics
- SEO Metrics
- Health Check – What I love about this bit is that it explains why the check has been done, the potential issues and then a tick if the issue already resolved within the site.
- Pages Analysis
- Meta Analysis – Ensuring all metadata is within best-practice lengths, similar to the data you can get from Screaming Frog.
- Content Analysis
- Link Analysis
- Image Analysis
- Mobile & Desktop Optimisation
- Usability
Like I said, I’m not usually a fan of these sorts of things, but there’s enough data in here to make it a really justifiable place to at least start with auditing a site.
It’s also incredibly easy to export and even email pre-done report to clients directly, so again it’s all about time saving and allowing you to be transparent with data and progress, without taking forever to actually put something like a custom Data Studio report together.
Backlink Monitoring
You can either import these manually from Google Search Console (if it’s your site you’re doing the monitoring on), or simply use the backlink checker tool to analyse any domain, much like when pasting any site into a tool like SEMrush in order to get that initial overview.
Checking your competitor sites specifically is one of the best ways to uncover link building opportunities, so with that in mind here’s a breakdown of areas you should be looking at within this section in order to make the most of the data:
- Referring Domains
- Follow Ratio
- Total Backlinks (including growth chart)
- New & Lost Domains
- Anchors
- Domain Map e.g. locations of the referring domains
You can then look at a domain breakdown and use a tool like Hunter to get the emails of the site owners to reach out to them, or if it’s something like a directory then you can just simply sign up yourself.
Again, the best thing about these larger sections is the new layout of the tool, which is just so smooth and easy to navigate, especially for a tool that is loaded with data.
SMM
SMM is the section where you can integrate your social profiles to track metrics and schedule posts. It’s not something I use personally, but it’s great if that’s something you also look after for your clients or are in the habit of scheduling posts at the start of the month, so it’s then not something you need to worry about once it’s out of the way.
Whether you use it or not, it’s a great integration option that again provides that added degree of control and capability to whichever sites you’re connecting to the account.
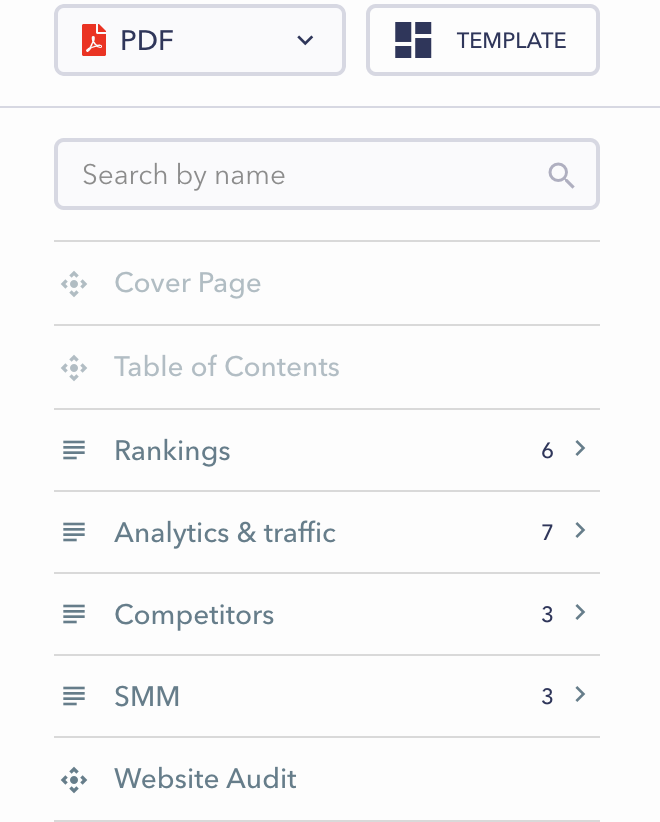
Report Builder
The final section I’m going to cover in this SE Ranking review is the report builder, and it’s arguably one of the best and most well-known parts of the tool.
The reason being is that it makes reporting so simply as you already have your analytics profiles integrated and the tool has done the hard work for you. Yes, reporting tools like Google Data Studio are great, but there’s always going to be that much steeper of a learning curve with them compared to something like this.
Plus, the reports just look amazing! If you’re stuck on whether to test the tool out, I’d urge you to do it just on the basis of the quality of reports than anything else (although all the other integrations are clearly worth their salt too).
Just a small selection of options:
This clearly makes SE Ranking one of the best tools for white label reporting currently available in 2022, and it’s just so user friendly, efficient, and it looks great.
Pricing
The tool is very modestly priced, given the range of integrations and the volume of data that you have to play with. It’s also priced in a really unique way, in which currently they’re offering discounts if you’re purchasing a subscription where data is refreshed less frequently.
At the time of writing, this is zero discount on packages with daily rank check frequency, 20% off for every 3 days and 40% off for weekly checks.
Standard pricing is then set at £23p/m for Optimum, £53 p/m for Plus and £122 p/m for Enterprise. I’d personally opt for the ‘Plus’ option, especially if you’re going to be growing your list of clients later down the line.
There’s also the really handy ‘Pricing Plan Calculator’ which accurately shows you what package is best for you based on the number of clients you have and what you want to get out of the tool.
Conclusion
Recommended For:
Anyone who wants a complete marketing suite that also extends to white label reporting. I feel that those with small agencies or 5-10 clients will get the most out of the tool. It’s even better if you’re dealing with smaller sites as you can keep the reporting nice and neat.
Not Recommended For:
If you’re already comfortable with your toolset and have a medium to large size agency or marketing operation, then it may not make much sense to switch.
Closing Thoughts:
This tool, with it’s new layout and continual addition of features, is clearly one to watch in 2022. There’s a reason why SEO’s are marketing agencies are flocking to it, and personally I’ll be sticking with it because it has made my life a whole lot easier!
Also, keep your eyes peeled for updates. As I continue to use this tool I will be adding to this review my thoughts, additional features (as there are quite a few that have been left out) and much more.
Sign Up For A Free Trial